Overview
A page-by-page tour of LeakLens.
Dashboard
Section titled “Dashboard”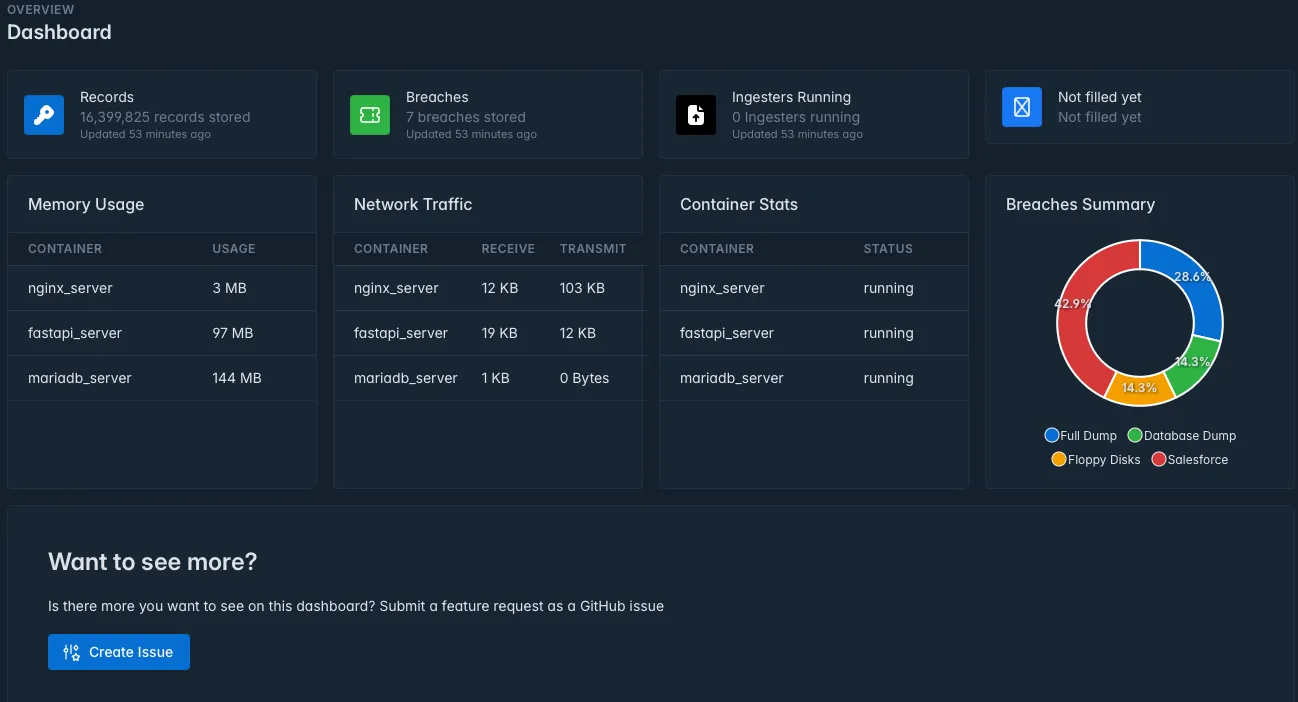
The dashboard gives you an at-a-glance view of your instance:
- Total Records — sum of all rows across every breach table
- Total Breaches — number of breach entries in the registry
- Docker Stats — live CPU, memory, and network I/O for each monitored container
- Breach Breakdown — donut chart showing record count per breach
Dashboard data is cached in the browser for 1 hour. Hard-reload the page to force a refresh.
Breaches
Section titled “Breaches”The Breaches page is the registry of every dataset loaded into LeakLens. Each breach has:
| Field | Description |
|---|---|
| Name | Human-readable label for the dataset |
| Threat Actor | Attributed source or actor |
| Type | Category of data (e.g. credentials, PII, combo) |
| Record Count | Number of rows in the breach’s data table |
| Ingested | Status: Yes / Pending / No |
| Date Added | When the breach was registered |
Creating a breach
Section titled “Creating a breach”Click Add Breach and fill in the metadata form. This creates an entry in the breach registry and an empty data table ready for ingestion.
Editing and deleting
Section titled “Editing and deleting”Click a breach name to open its detail panel. From there you can edit any metadata field or delete the breach entirely. Deleting a breach drops the underlying data table — this is irreversible.
The Users page shows every registered account as a card with avatar, username, user ID, and role badge.
| Role | Level | Description |
|---|---|---|
| user | 0 | Read-only access |
| contributer | 1 | Can add breach data |
| manager | 2 | Can edit breach metadata |
| admin | 3 | Can manage users |
| owner | 4 | Full access |
| root | 5 | System-level access |
The first account registered on a fresh instance is automatically assigned Owner (level 4).
Search
Section titled “Search”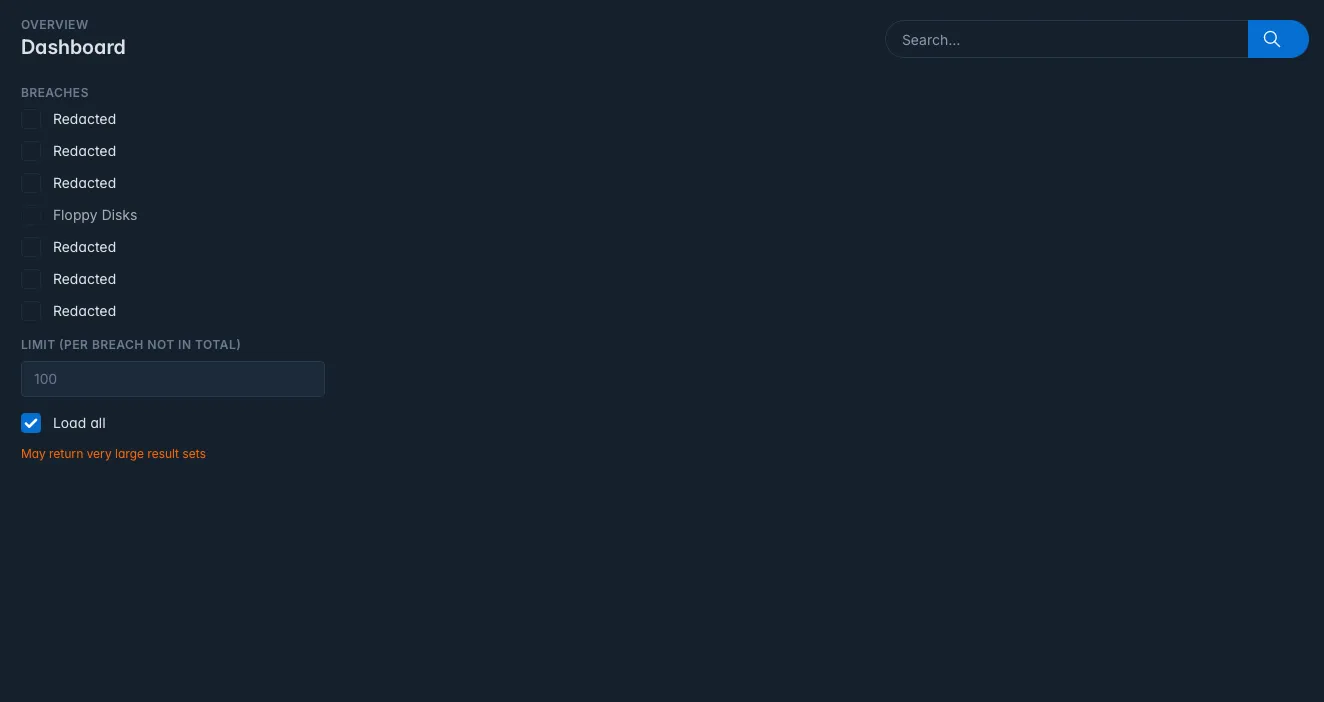
The search page lets you query any breach table using a keyword-based syntax. See the Search docs for the full query language reference.
Key options on the search page:
- Breach selector — choose which breach table to search
- Results per page — controls how many records are fetched per request (default 100)
- Load all — streams through all matching records in chunks
Results are displayed as cards with four tabs: Overview, PII, Extra, and Source.
The Map page plots breach records on an interactive world map using geographic coordinates stored in breach data.
- Each breach is assigned a unique color derived from its name
- Markers are clustered at high zoom levels for performance
- Clicking a marker shows the associated PII and coordinates from that record
- Supports light and dark tile themes, synced to the UI theme toggle
Only breach tables that contain lat/lng values in their extra data column will contribute markers.
Settings
Section titled “Settings”Account-level settings for the currently logged-in user:
- Avatar — upload a profile image
- Username — change your display name
- Password — update your login password
- API Tokens — create and revoke long-lived API keys for direct API access
Server Settings
Section titled “Server Settings”Admin-only configuration panel (requires Manager role or higher):
- Edit live database connection settings and server metadata
- Update Record Counts — re-scans all breach tables and corrects stored row counts (useful after bulk imports)
Changes are written directly to config/server_config.yml and take effect without a container restart.